
Reading Graphs, Tables and Charts for NSW OC and Selective Maths
Graphs, tables and charts are used in Mathematical Reasoning to present information quickly. However, finding the correct answer often requires more than…
Graphs, tables and charts are used in Mathematical Reasoning to present information quickly. However, finding the correct answer often requires more than reading a single number. Students may need to compare categories, calculate changes, work with percentages or combine several values.
A useful habit is to check the title, labels, scale and units before starting any calculation.
1. Bar Charts: Compare Quantities
Bar charts compare values across categories. A taller bar represents a larger quantity, but students should always read the scale rather than judge by appearance alone.
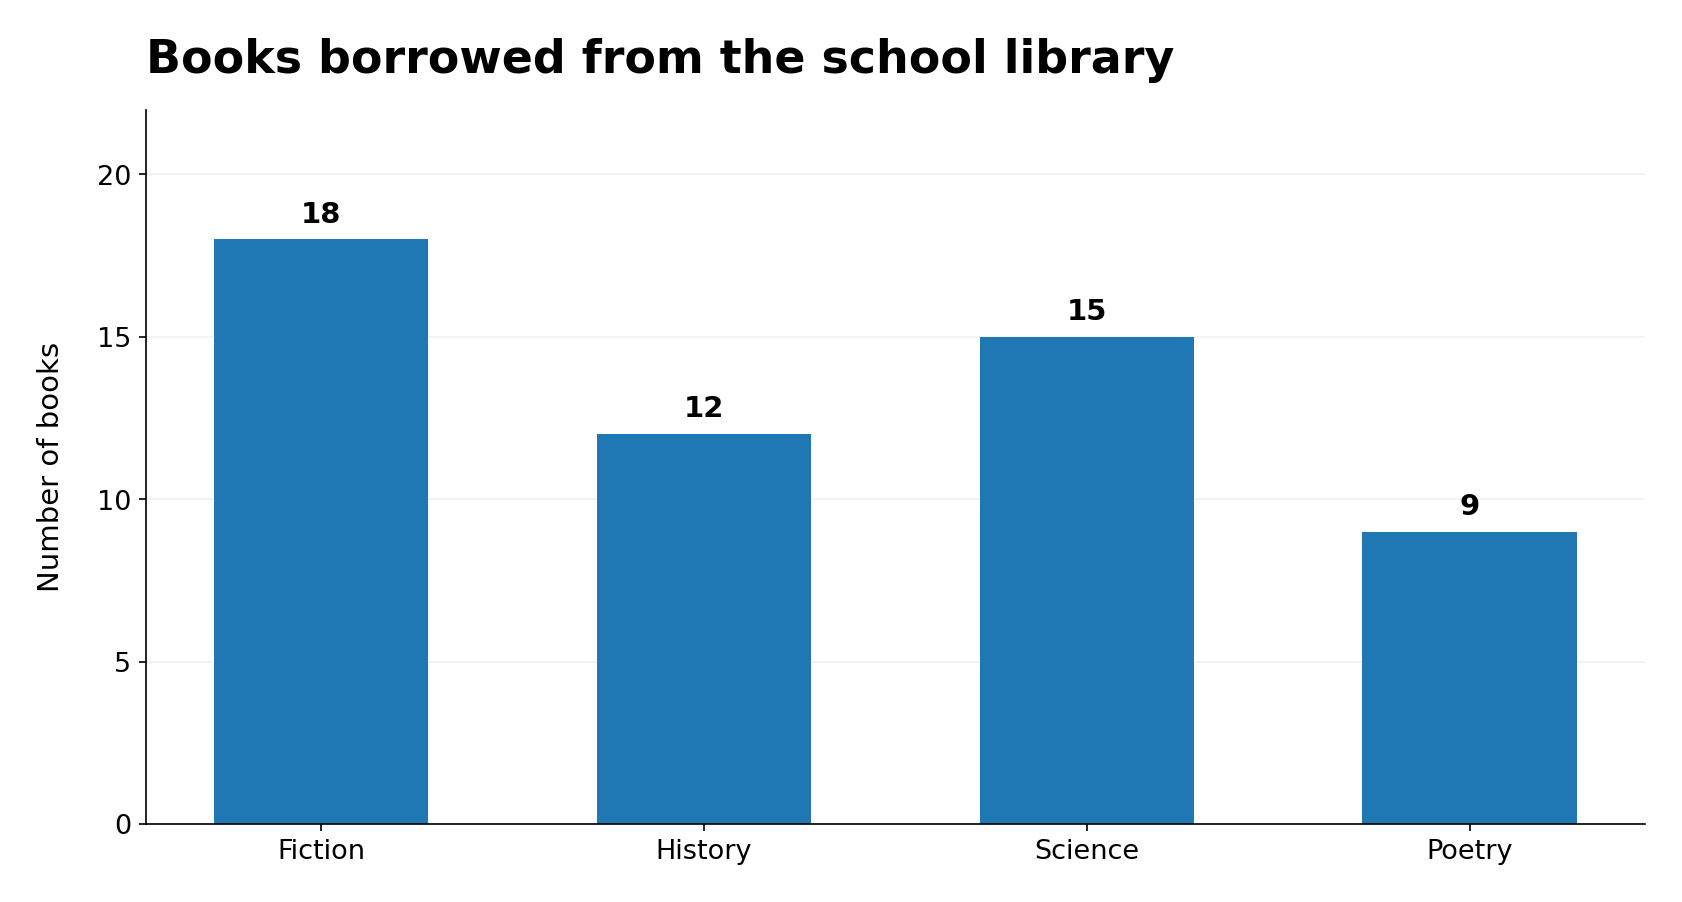
Question: How many more Fiction and Science books were borrowed than History and Poetry combined?
Solution: (18 + 15) − (12 + 9) = 12 books.
Key tip: Check where the vertical axis starts and how much each interval represents. The question might ask for a combined total, not just the tallest bar.
2. Line Graphs: Track Change Over Time
Line graphs show how values change, often over days, months or years. A rising line indicates an increase, while a falling line indicates a decrease.
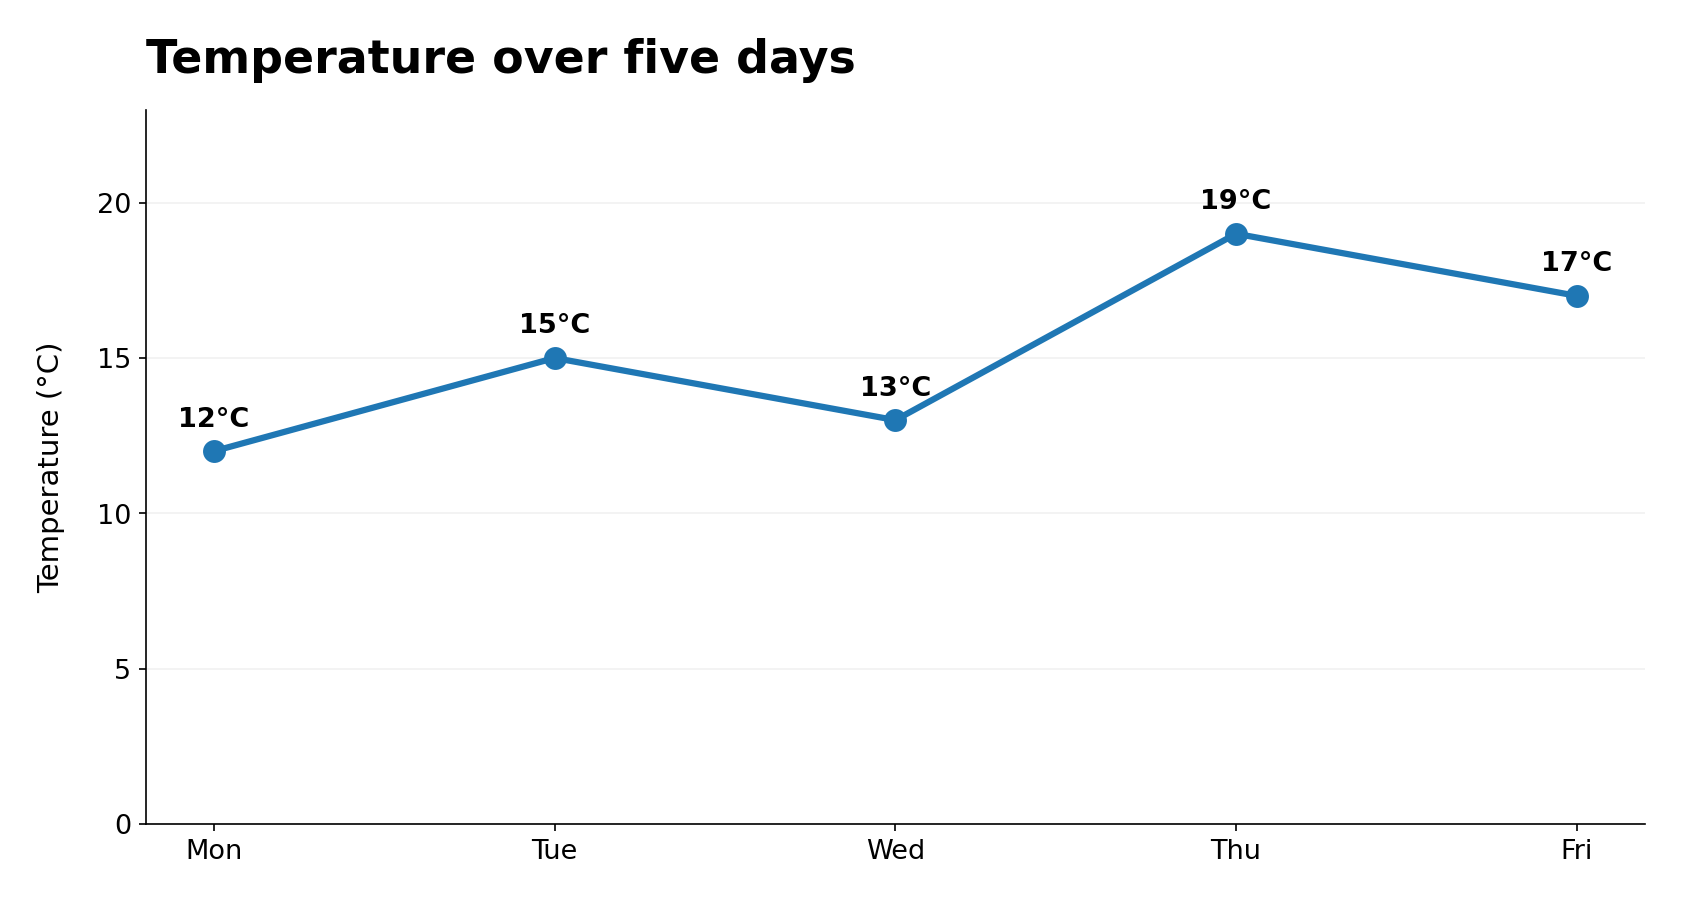
Question: Between which two consecutive days did the temperature increase the most?
Solution: Wednesday to Thursday, from 13°C to 19°C, an increase of 6°C.
Key tip: Compare the actual differences between values. The highest point is not necessarily where the largest increase occurred.
3. Pie Charts: Understand Parts of a Whole
A pie chart divides a total into parts. The whole circle represents 100%, so the total number of people or objects is important when calculating actual quantities.
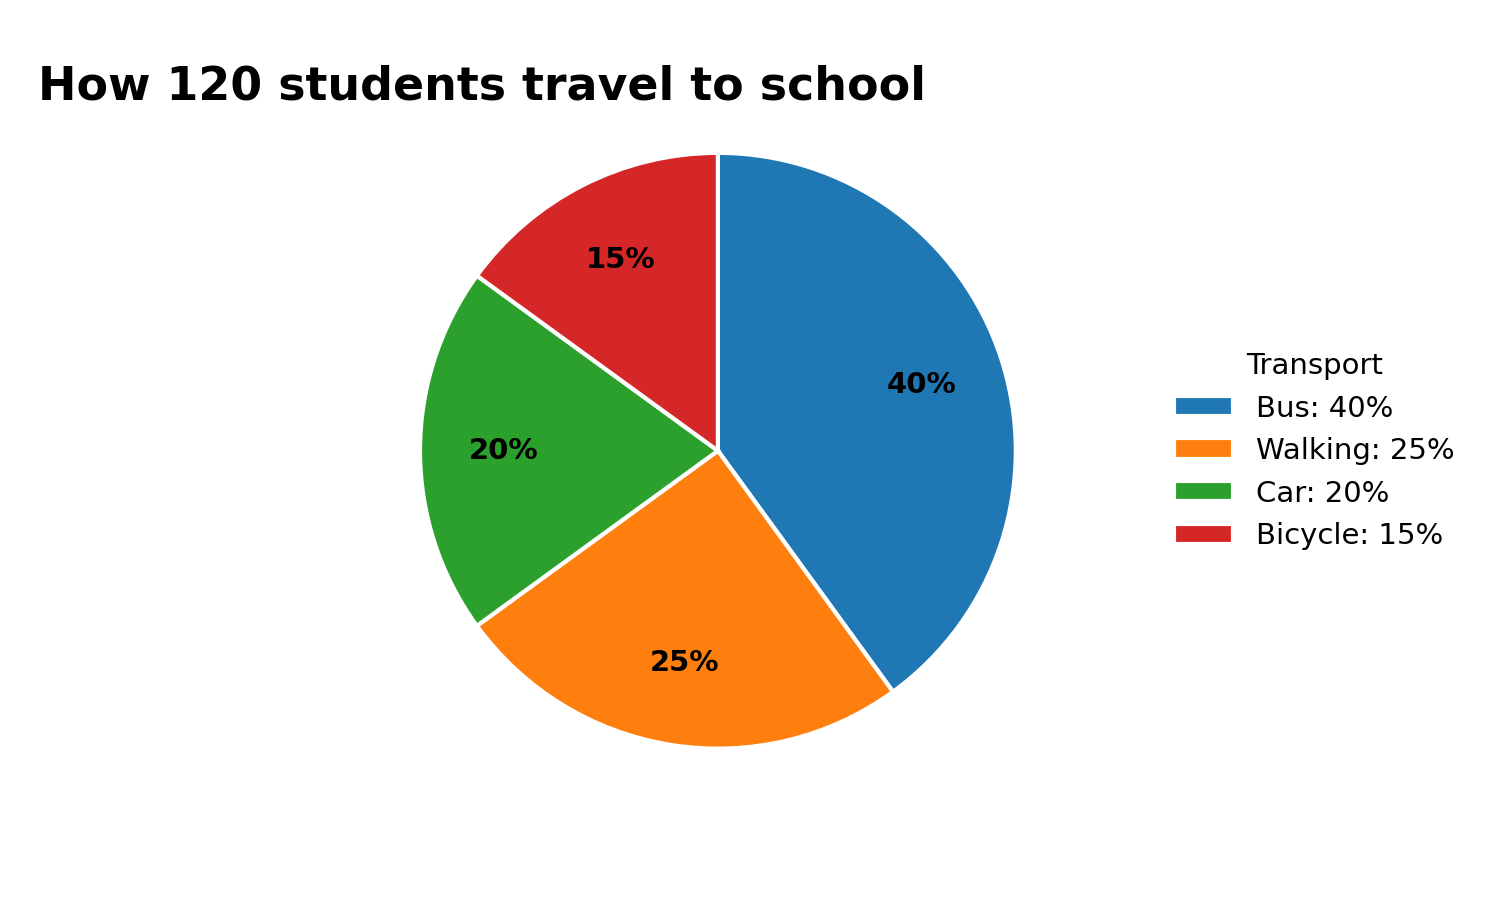
Question: How many more students travel by bus than by bicycle?
Solution: (40% − 15%) × 120 = 25% × 120 = 30 students.
Key tip: A percentage is not an actual number until you know the total. Remember that the whole circle also represents 360°.
4. Tables: Combine Rows and Columns
Tables present exact values in rows and columns. The challenge is often choosing which figures to combine.
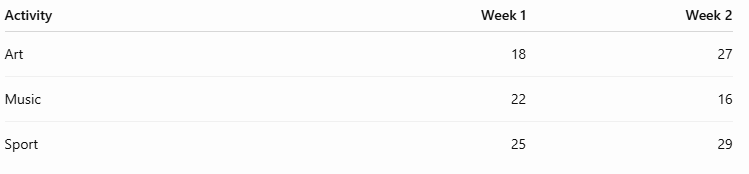
Question: How many more enrolments were recorded in Week 2 than Week 1?
Solution:
Week 2 total = 27 + 16 + 29 = 72
Week 1 total = 18 + 22 + 25 = 65
Difference = 7 enrolments.
Key tip: Check row and column headings carefully. Some questions require totals across several categories before comparing them.
5. Pictographs: Check the Key
Pictographs use repeated symbols to represent data. One symbol may stand for several items, not just one.
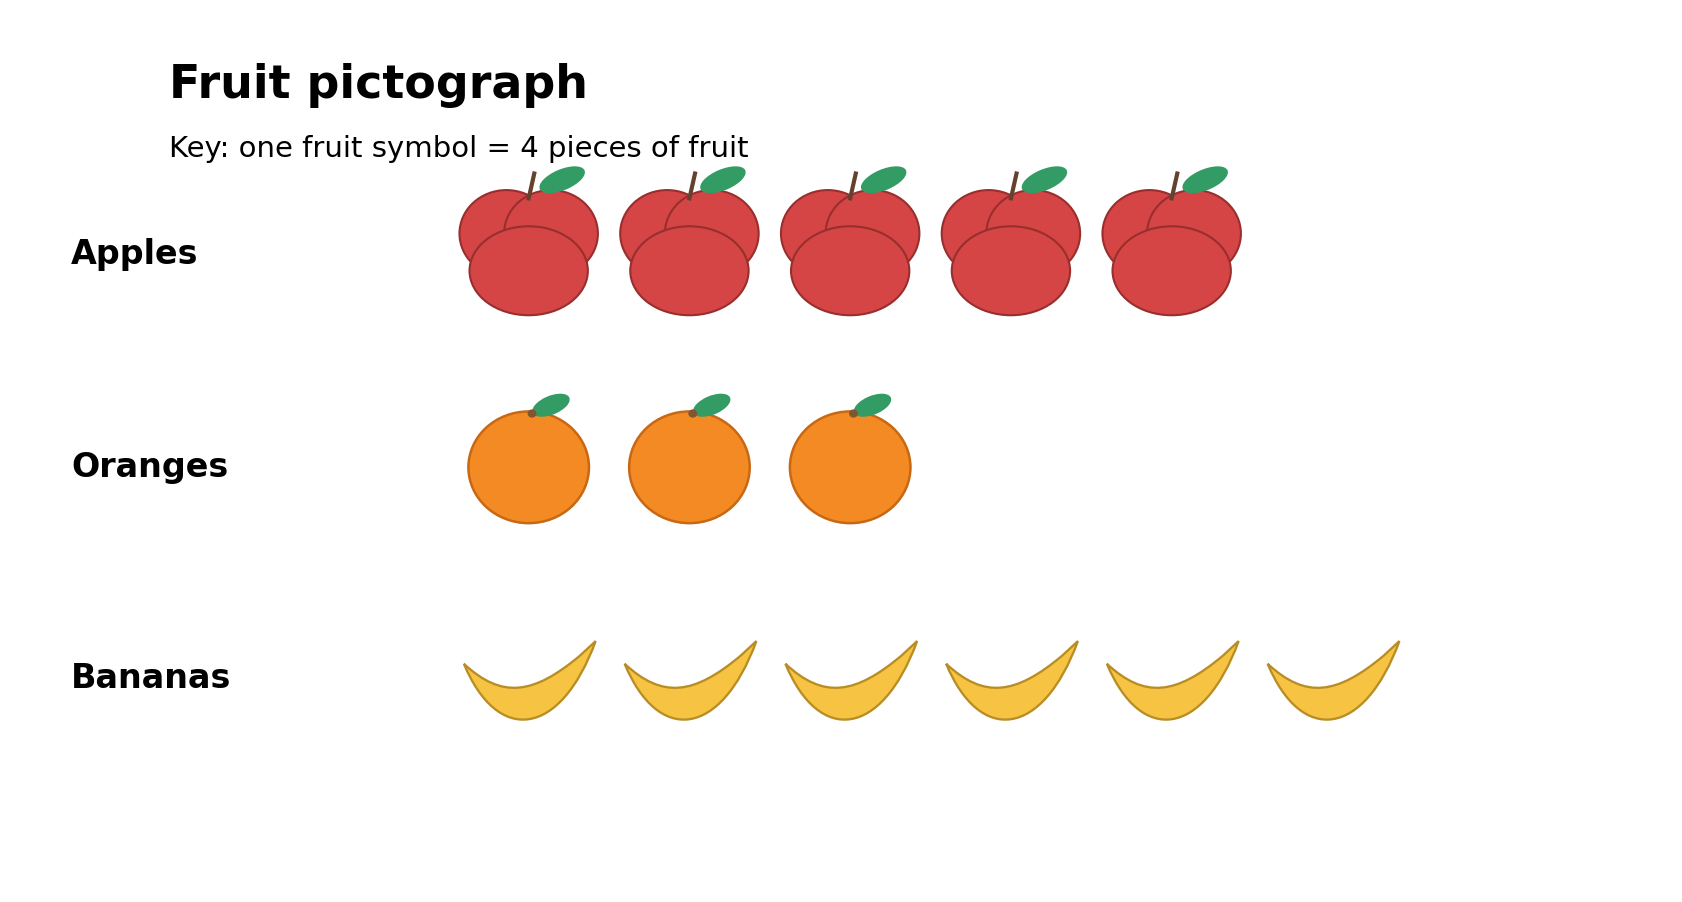
Question: How many more bananas than oranges are shown?
Solution: There are six banana symbols and three orange symbols. Each represents four pieces of fruit, so:
(6 − 3) × 4 = 12 pieces of fruit.
Key tip: Always read the key. If half-symbols are used, they represent half the quantity shown in the key.
A Four-Step Approach to Data Questions
Read: Check the title, scale, labels, units and legend.
Understand: Identify whether the question asks for a total, difference, trend, average or percentage.
Calculate: Use only the relevant values, combining them in the correct order.
Check: Decide whether the answer is reasonable and uses the right units.
In harder OC and Selective questions, the chart itself may be simple. The challenge comes from deciding which information matters and carrying out two or three calculations accurately.
Practise Interpreting Data
With regular practice, students can become faster at finding information and more confident when graphs or tables appear inside multi-step problems.
At Selective Journey, students can develop these skills through Learning topics, worked examples and timed Mathematical Reasoning practice tests.
Explore our NSW OC practice tests and NSW Selective practice tests, or register for a free trial.